
- What do
1:10,1:2:10100:-25:0do? Think, then check. - Let
x = [2 5 1 6]. What willx(3),x([1 2]),x([1:end]),x(end:-1:1),x(:),x([1 1 1 1])do? Think, guess, discuss with a friend, and finally, verify. - When creating a matrix, a space or a comma (
,) are the separator between columns, while a semicolon (;) separate between rows. Figure out how to create the following matrices: \(\begin{pmatrix} 1& 2& 3\\ 4&5&6 \end{pmatrix}\), \(\begin{pmatrix} 1& 0 &1 \\ 0& 1& 0 \end{pmatrix}\) - You can nest matrix construction so that
[ 6 (1:5) 7 ]makes sense (what does it result in?) Similarly you can create a matrix by stacking column vectors next to each other (using a space or a comma) or row vectors on top of each other (using a semicolon). Create the following matrix using a relatively short line of code:\begin{equation} \begin{pmatrix} 1 &2&3&4&5&6&7&8&9&10\\ 1&4&9&16&25&36&49&64&81&100\\ 2&4&8&16&32&64&128&256&512&1024 \end{pmatrix} \end{equation}Can you now easily make the first list go up to 100 (and the others follow suit)? If not, solve the problem again so that you can do it.
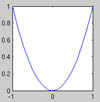
The plot command plots a list of points given as two vectors, \(X\) and \(Y\) of their x- and y- coordinates, respectively. The default behaviour is that no mark is placed on the points, and the points are joined by a straight line. So if we want to plot a parabola \(y=x^2\) for \(x\in[-1,1]\) we can write:
|
Graphing a simple function, y=x^2. |
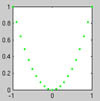
We could make that line green by adding a third input:
|
Stylizing the graphs with colors and line markers. |
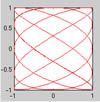
The resulting plot need not be a function in the mathematical sense of the word:
|
Graphing a non-function in MATLAB®. |
Exercise 10. Read the helpfile on plot by typing help plot and figure out how to do the following:
- Plot only the points and not the lines
- Plot the parabola sideways (the result is not a function)
- Plot using a red, dashed line and stars at each point
- Make the plot with less points so that you can see that the lines between the points are straight
- Plot the function \(\sin x\) vs. \(x\), for \(x\in [0,6\pi]\)
-
Figure out how to plot two functions with the same
plotcommand, and plot \(\sin x\) and \(\cos x\) vs. \(x\).