
Instructor Insights pages are part of the OCW Educator initiative, which seeks to enhance the value of OCW for educators.
Course Overview
This page focuses on the course 18.05 Introduction to Probability and Statistics as it was taught by Dr. Jeremy Orloff and Dr. Jonathan Bloom in Spring 2014.
18.05 is an elementary introduction to probability and statistics for students who are not math majors but will encounter statistics in their professional lives. Topics include basic combinatorics, random variables, probability distributions, Bayesian inference, hypothesis testing, confidence intervals, and linear regression.
In Spring 2014, class sessions emphasized active learning, with students engaging in concept questions, discussions, board problems, and computation using R. Outside of class, students used the MITx platform for interactive reading questions and problem set checkers.
Course Outcomes
Course Goals for Students
The primary goal of the course is for students to become more sophisticated consumers of probability and statistics. After this course, students should be able to understand the statistics they encounter in research literature, be able to critique papers or experimental setups, and work with a statistician to analyze data.
Students who are interested in becoming statisticians themselves can build a solid foundation in probability and statistics through this course but should plan on additional coursework for thorough and comprehensive preparation.
Possibilities for Further Study and Future Careers
Most students who take the course plan to become physicians, engineers, or researchers in fields other than mathematics, in which they will encounter probability and statistics. This is the terminal mathematics course for many of the enrolled students.
Instructor Insights
In the following pages, Dr. Orloff and Dr. Bloom discuss additional aspects of 18.05:
A Day in 18.05
Class sessions were extremely active and student-centered, with a mix of lecture, concept questions and discussion, board problems, and demonstrations and simulations. This section uses one sample class to give a glimpse of the rhythm of 18.05.
Timeline
The progression of the class is shown in the timeline below. Click on any color block to watch that portion of the class in the video below.


Each in-class activity type is pictured in an image gallery with descriptive commentary from Dr. Jeremy Orloff and Dr. Jonathan Bloom. In the key below, click on an activity type to see the corresponding image gallery.

 for the day.</p>") Class introduction: Announcements and overview
Class introduction: Announcements and overview
 Board problem: Extended problem that student teams collaborate on at whiteboards
 Lecture: Brief lecture reviewing content covered in readings
 Demonstration or simulation: Instructor-led demonstrations or student experiments with dice.
 Concept question: Multiple-choice question that students respond to via handheld clickers
 Discussion following concept or board questions
Resources for Sample Class (Class 11–Bayesian Updating: Discrete Priors)
This video features the happenings of a full 18.05 class session.
Curriculum Information
Prerequisites
Calculus I GIR ![]() . The following versions of Calculus I are on OCW: 18.01SC, 18.01, 18.01, 18.013A, and 18.014.
. The following versions of Calculus I are on OCW: 18.01SC, 18.01, 18.01, 18.013A, and 18.014.
Requirements Satisfied
- REST

- Can be applied toward a Bachelor of Science in Mathematics
- Can be used to satisfy the probability and statistics requirement for a Bachelor of Science in Brain and Cognitive Sciences
Offered
Every spring semester
The Classroom
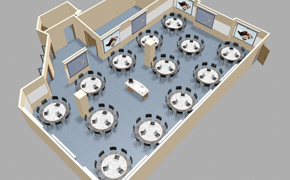
 Photo 1 of 2
The class met in a classroom equipped for Technology-Enabled Active Learning (TEAL). The classroom includes 13 round tables, each of which seats up to 9 students. The seating arrangement invites collaboration and discussion, which are key in 18.05 (Image courtesy of Mark Bessette).
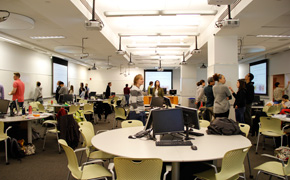 Photo 2 of 2
 The walls of the classroom are lined with white boards and screens. Cameras and projectors are arranged such that slides and live activity at any white board can be captured and projected onto screens around the room. Desktop computers were available but were not used.
Assessment
The students' grades were based on the following assessment elements:
10% Reading questions (graded for correctness) and in-class clicker questions (graded for completion). 25% Problem sets; lowest problem set grade is dropped. 15% Exam 1 15% Exam 2 35% Final examStudent Information
Breakdown by Year
Mostly juniors, some sophomores, some seniors.
Breakdown by Major
The students enrolled this semester were primarily life sciences majors. There were a fair number of students who planned to become doctors, researchers, or engineers. Math majors who are interested in probability and statistics tend to take 18.440 Probability and Random Variables. Electrical engineering and computer science majors who are interested in probability and statistics tend to take 6.041 Probabilistic Systems Analysis and Applied Probability.
Typical Student Background
Students tend to be upperclassmen. They enter the class as mature students, prepared to do work and manage their time. In addition, many of the students have already had exposure to reading research or even doing research, and so they can place a lot of these ideas in a context that’s familiar to them, especially when it comes to medical research.
The only prerequisite for this course is single-variable calculus. Students with a stronger mathematical background often find this course easier.
Ideal Class Size
Given the current staffing arrangement and classroom, the ideal class size is up to 75. The classroom is intended for up to 100 students. With 75 or fewer students, there’s ample room for everyone to get up and work on the white boards without feeling cramped. A class size of less than 75 also allows the instructors and students to get to know each other. With too few students, the classroom might feel way too big.
During an average week, students were expected to spend 12 hours on the course, roughly divided as follows:
Lecture and Active Learning
- Two sessions per week, each lasting 1.5 hours; 27 sessions total
- Attended by all students
- Included brief lectures, demonstrations, and frequent opportunities for student participation: concept questions, discussion questions, board problems. These time types are described in image galleries linked from the timeline key for A Day in 18.05.
R Studio
- One session per week, lasting 1.5 hours; 10 sessions total.
- No new math content was introduced.
- Students used R, a free statistical software package, via the user interface RStudio, to apply statistical tools, visualize data, and explore concepts through simulations.
- Real-world examples were frequently incorporated.
- Students used and modified pre-written code to build their conceptual understanding of the week’s topics.
Out of Class
- Readings and reading questions before each class meeting
- Nine problem sets, due on non-class days so that students wouldn't forego class readings in order to complete problem sets.
- Preparation for exams
- Optional office hours on Thursdays, Fridays, Sundays, and Mondays
Semester Breakdown
| WEEK | M | T | W | Th | F |
|---|---|---|---|---|---|
| 1 |  |  |  | |  |
| 2 |  | | | | |
| 3 | | | | | |
| 4 | | | | | |
| 5 | | | |  | |
| 6 | | | | | |
| 7 | | | | | |
| 8 | | | | | |
| 9 | | | | | |
| 10 | | | | | |
| 11 | | | | | |
| 12 | | | | |  |
| 13 | | | | | |
| 14 | | | | | |
| 15 | | | | | |
| 16 | | | |  | |
 No classes throughout MIT Lecture and active learning
 Exam
Exam No class session scheduled R Studio
 Problem set due


 The instructors and assistants circulated around the room to see how students were approaching the problems and where students were getting stuck. When helping, we paid extra attention to groups that were struggling to make progress and sometimes asked more challenging follow-up questions to groups that finished quickly. We wanted to get everyone to about the same point so that we could discuss the solution productively as a class.</p>
<p>In most introductory-level math courses at MIT, problem sets include a mix of drill problems and more challenging problems. Because we worked through so many problems in class and to some extent on the reading questions, we were able to focus the problem sets on challenging problems.</p>")


Course Team Roles
During Spring 2014, there were two lead instructors and three teaching assistants in the classroom at all times. Much of class time was devoted to board problems, during which all five members of the teaching staff circulated around the classroom and worked with students. The course was generously staffed during the 2013 and 2014 offerings to support the transformation in curriculum and pedagogy. From 2015 onwards, the course will likely have a smaller staff.
Lead Instructors (Dr. Jeremy Orloff and Dr. Jonathan Bloom)
- Designed the course syllabus and structured the course
- Prepared nearly all course materials, including readings, problem sets, lecture slides, and R studio materials
- Led each class session, gave brief lectures, conducted demonstrations, and worked with students on board problems
Teaching Assistants (Ruthi Hortsch, Erika Trent, and Dr. Peter Kempthorne)
- Supported all class activity, particularly student work on board problems
- As a statistician, Dr. Peter Kempthorne advised the lead instructors on teaching related to statistics and was key in developing the R studios.
Graders (undergraduate students)
- Graded the nine problem sets for the course