
The following demonstrations are graphic representations of concepts discussed in the lecture notes (PDF).
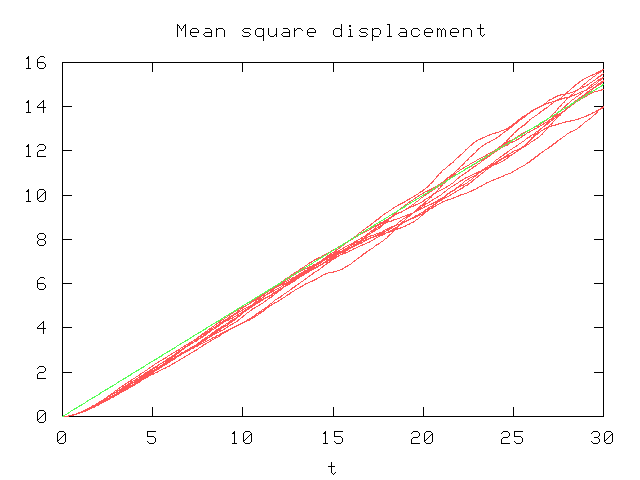
Page 1: Random flight
- mean sq displacement (PNG)
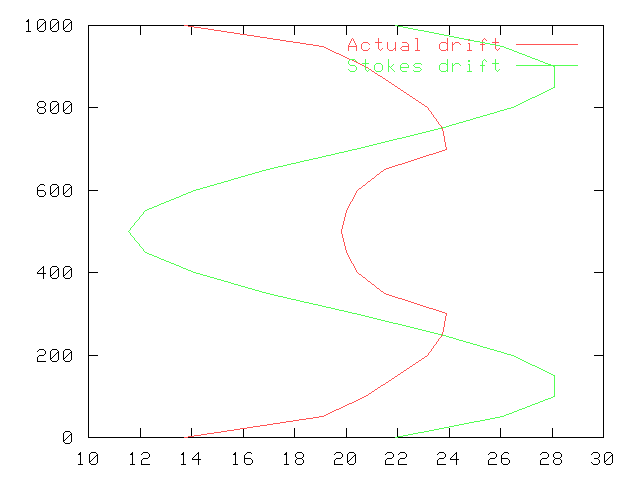
Page 8: stokes drift
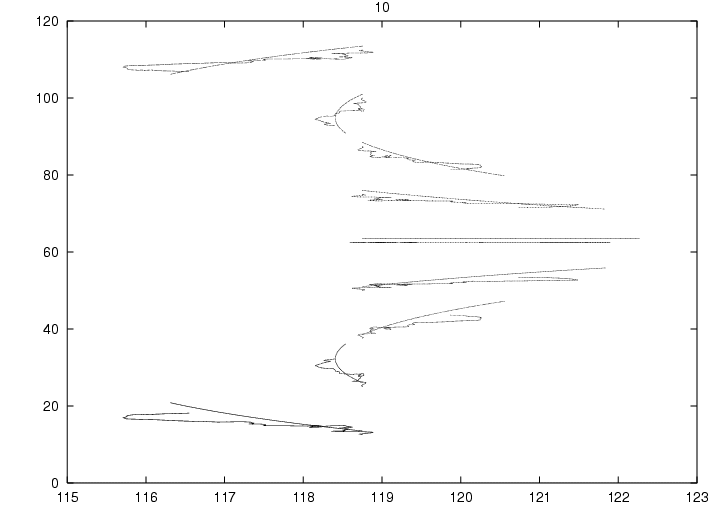
Page 8: psi
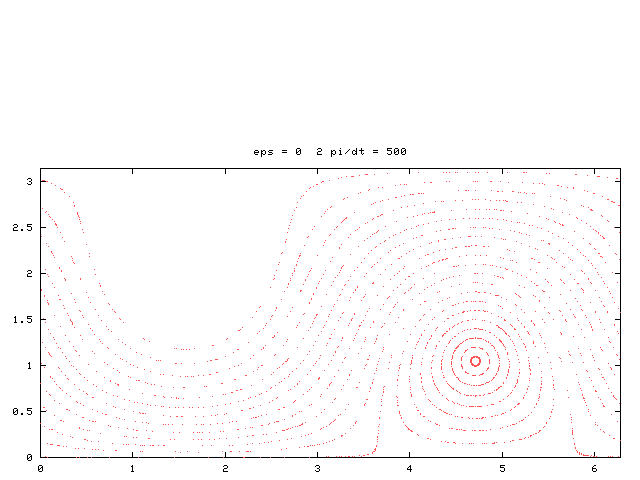
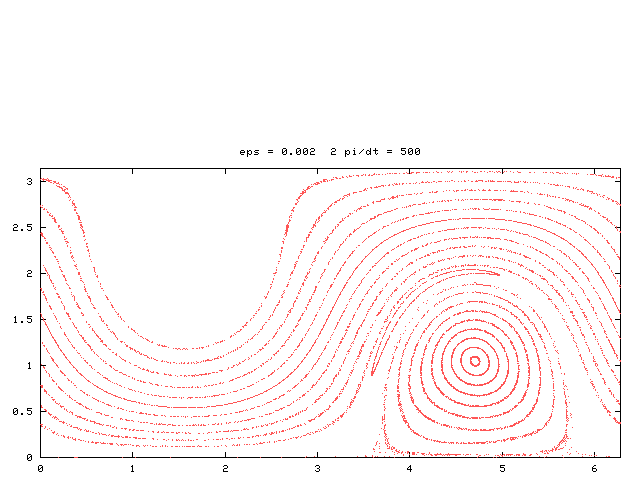
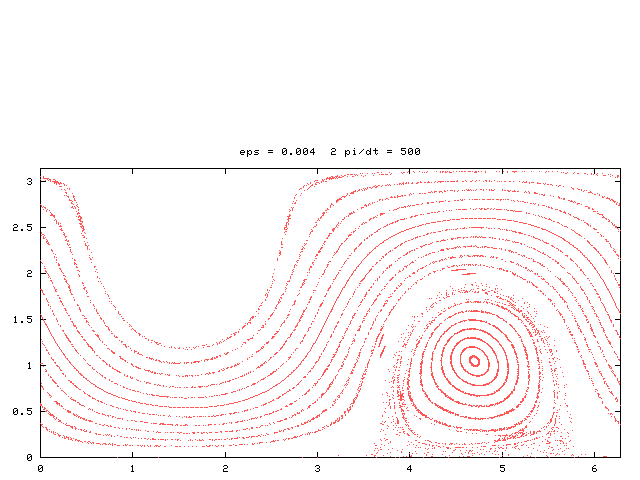
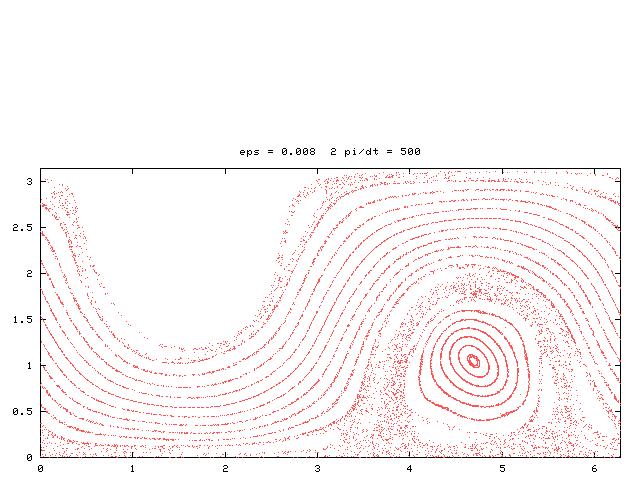
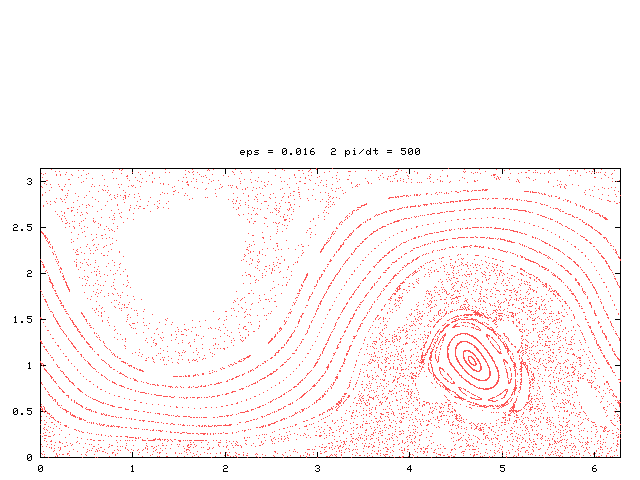
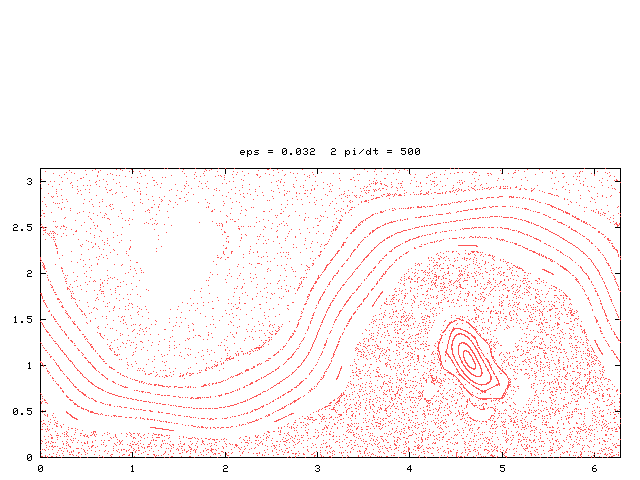
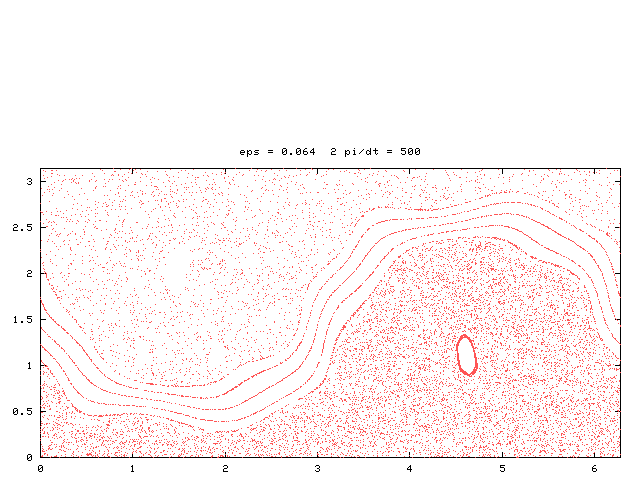
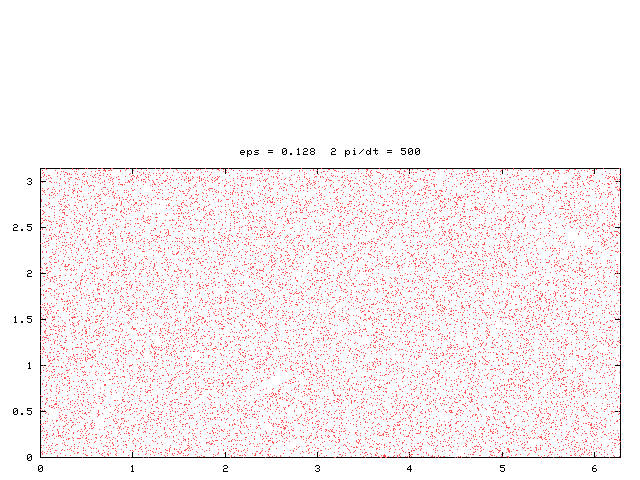
Page 9: poincare sections
- alpha=0 (PNG)
- alpha=0.002 (PNG)
- alpha=0.004 (PNG)
- alpha=0.008 (PNG)
- alpha=0.016 (PNG)
- alpha=0.032 (PNG)
- alpha=0.064 (PNG)
- alpha=0.128 (PNG)
Page 9: Continuum
- steady (GIF - 5.5MB)
- weak (GIF - 5.5MB)
- strong (GIF - 5.5MB)
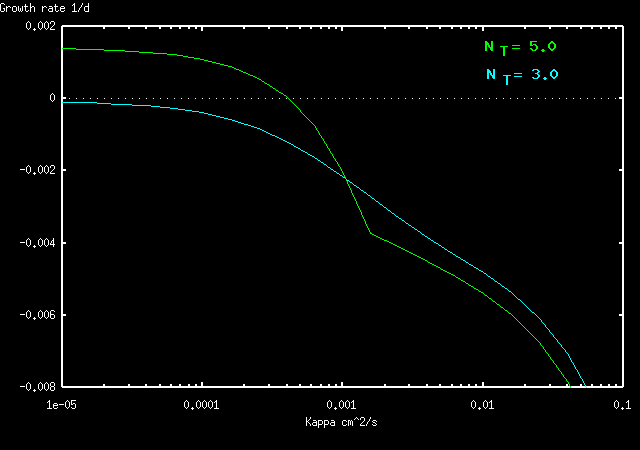
Page 10: bio dynamics
- growth rates (PNG)
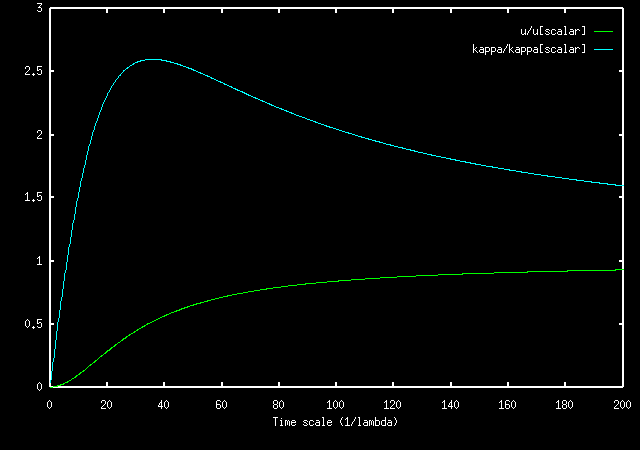
Page 13: effective coeff
- effective k,v (PNG)