
The following demonstrations are graphic representations of concepts discussed in the lecture notes (PDF).
Page 2: 2D
- psi (GIF - 11MB)
- zeta (GIF - 22MB)
Page 2: Statistics
- spectra (GIF - 1.5MB)
- pdf of zeta (GIF - 2.2MB)
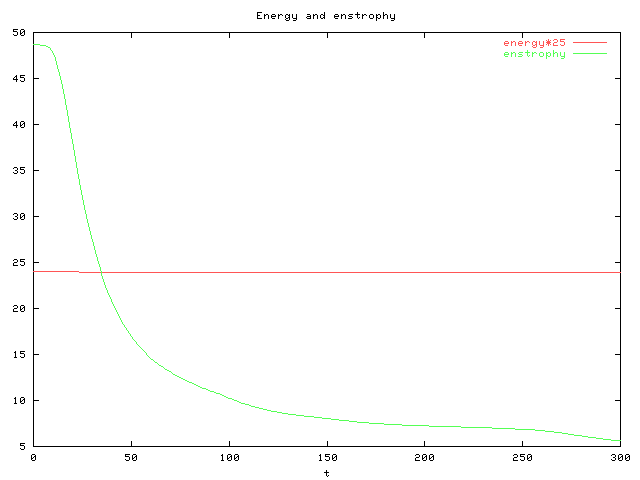
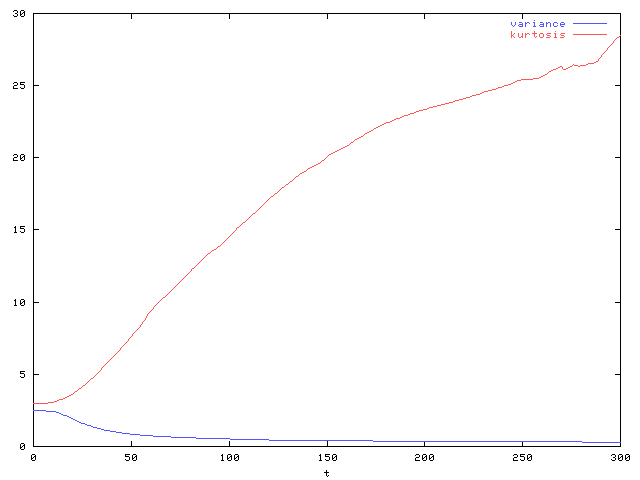
Page 2: Averages
Page 3: mean k
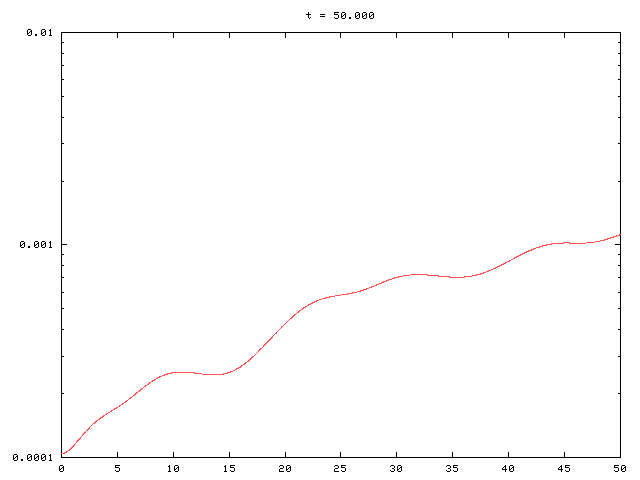
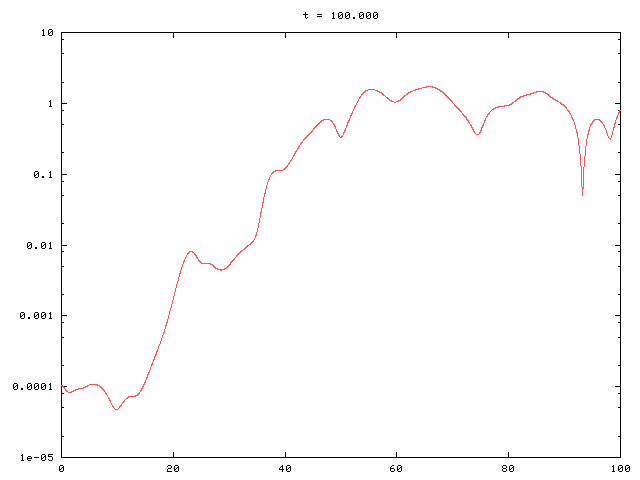
- kbar vs time (PNG)
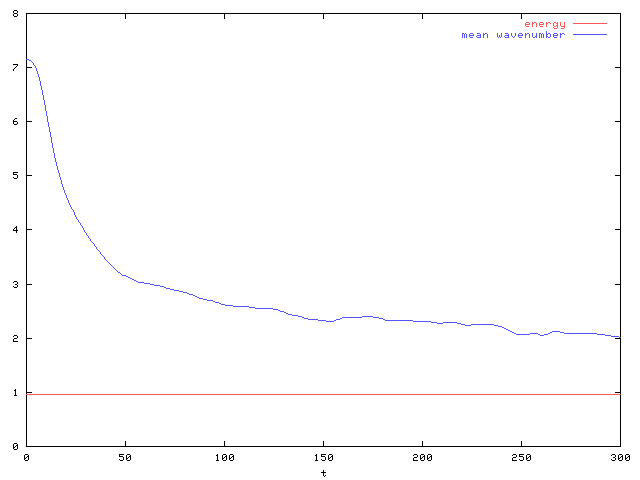
Page 5: Point vortex simulations
- n=3 (GIF)
- delta solutions (PNG)
- n=4 (GIF)
- delta (PNG)
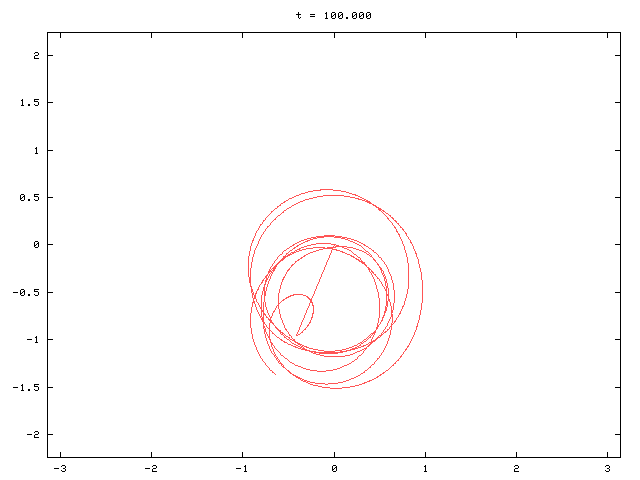
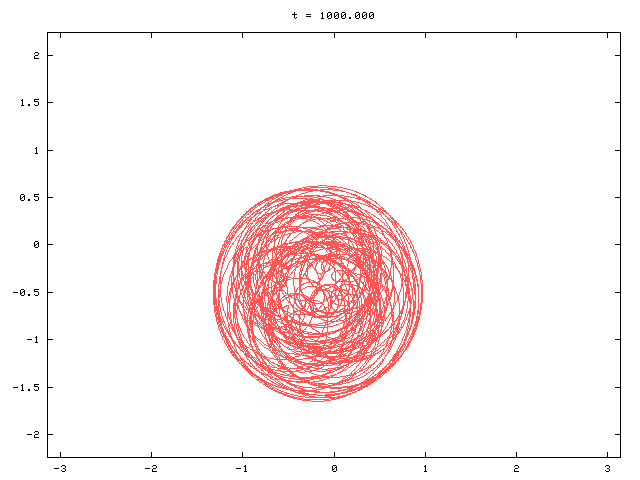
- single vortex trajectory (PNG)
- long example (PNG)
Page 7: Vortex waves
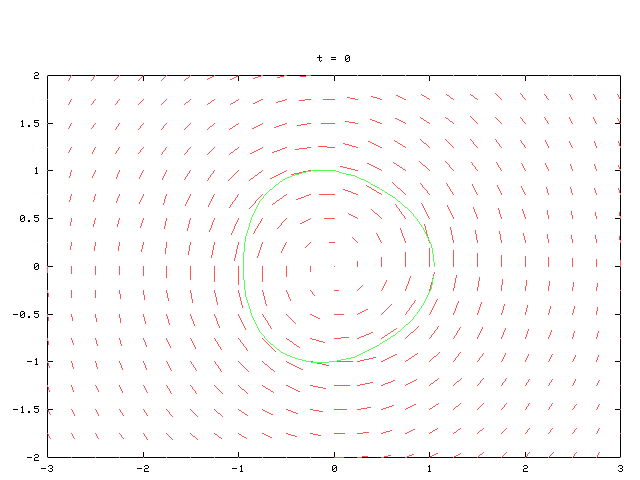
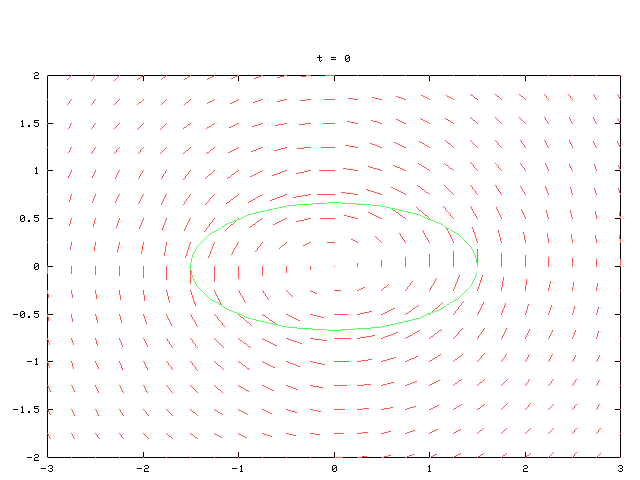
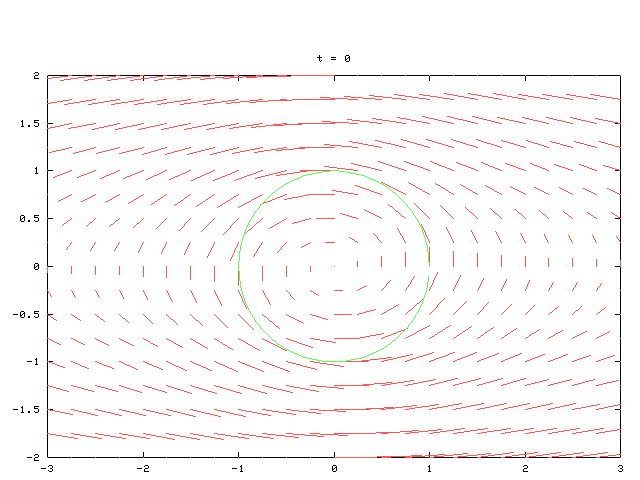
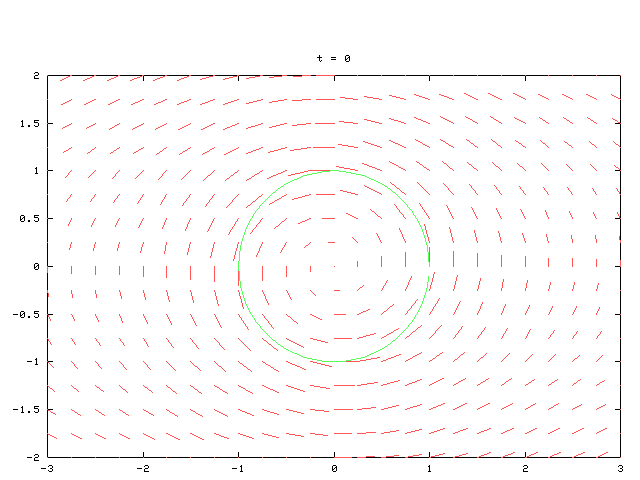
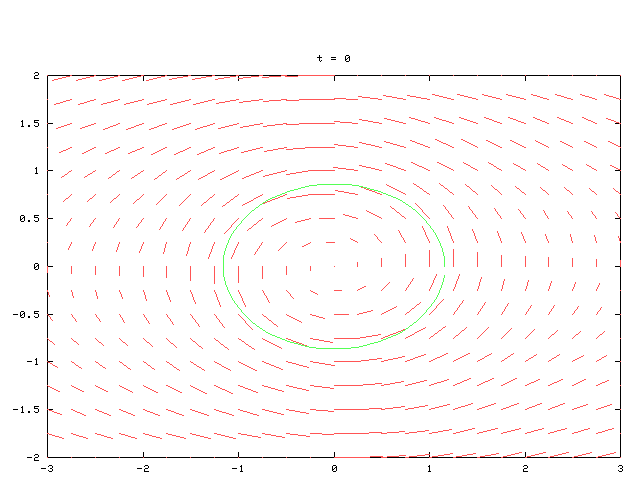
Page 7: Vortices in shear
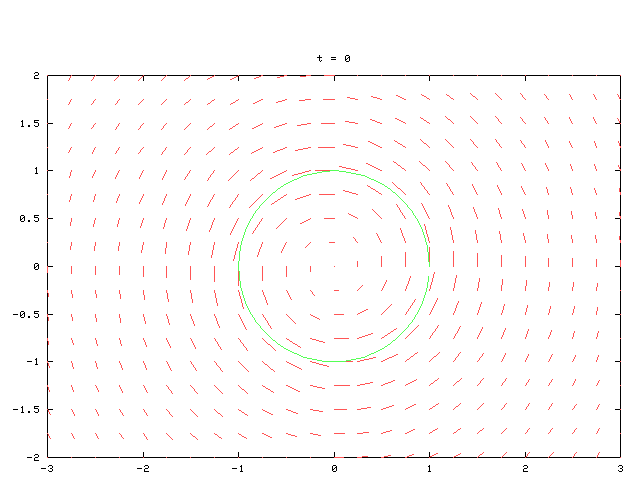
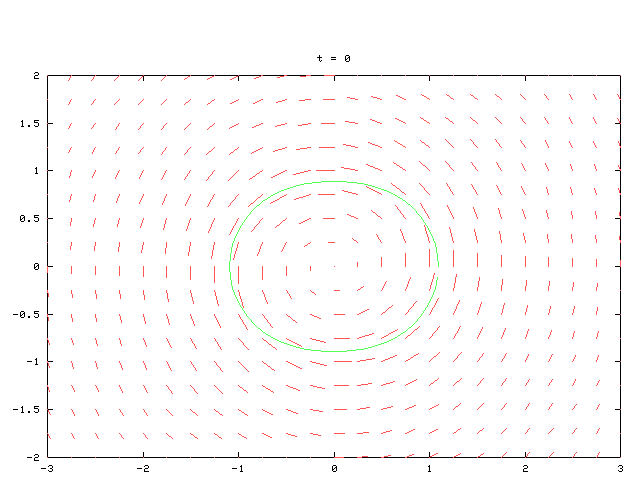
- elliptical (PNG)
- go (GIF)
- strong shear (PNG)
- go (GIF)
- weak shear (PNG)
- go (GIF)
- balanced (PNG)
- go (GIF)
- adverse (PNG)
- go (GIF)
- adverse weak (PNG)
- go (GIF)